Software > Controlling and Cost Accounting > KPI, Balanced Scorecard > Peakboard Designer
user-friendly low-code software to quickly create interactive dashboards to visualise

Peakboard Designer

user-friendly low-code software to quickly create interactive dashboards to visualise


Demo version

What is Peakboard Designer?

Peakboard Designer is a powerful low-code software for the visualization, analysis and control of production and business processes. The solution enables companies to capture and process complex data in real time and display it on user-friendly dashboards without extensive programming knowledge. Peakboard Designer connects data from various sources such as ERP, MES and SCADA systems, databases or IoT devices and presents them clearly in an intuitive user interface.

Advantages of Peakboard Designer

  • Real-time data integration: Connection of different data sources such as SAP, SQL, JSON, Excel or OPC UA in a single application.
  • Fast implementation: Thanks to the drag-and-drop functionality, individual dashboards can be created without complex programming.
  • Interactive control: Create user-friendly HMI solutions to control machines and production processes directly from the dashboard.
  • Automated data processing: With Dataflows, data can be cleansed, aggregated, linked and filtered to make informed decisions.
  • Free trial: Simply download, install and get started immediately without registration.

Highlights of the Peakboard Designer software

  • Building Blocks: Visual code editor for creating process logic without programming effort.

  • Template gallery: Ready-made templates for various industries and use cases.

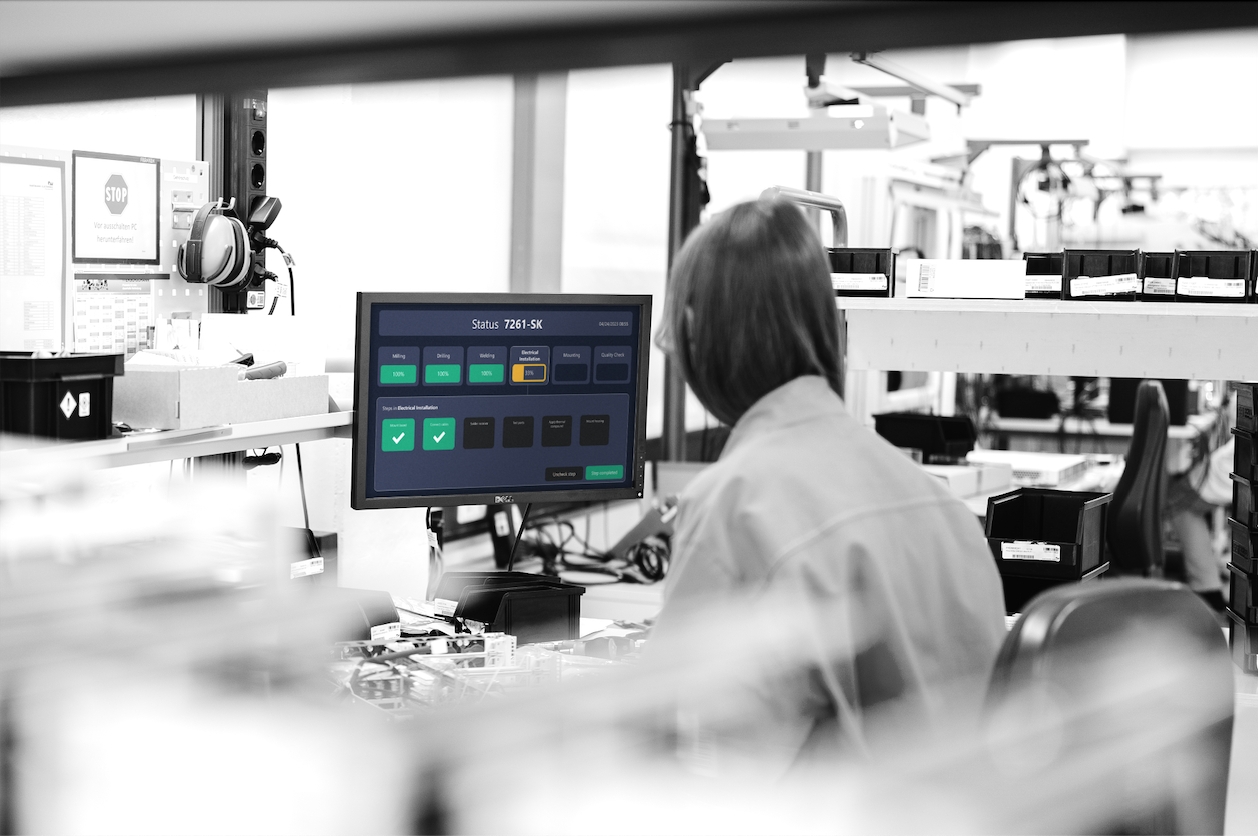
  • Conditional Formatting: Dynamic customization of dashboards based on predefined states and signals.

  • Interactive control: Connection with external devices such as barcode scanners, signal lights or switches.

  • Multilingual support: Software and support are available in German and English.

Important features in detail

Low-code dashboard design

With the user-friendly drag-and-drop interface, even users without an IT background can design professional dashboards. Thanks to building blocks, even complex logic, such as loops or conditions, can be created without programming knowledge.

Comprehensive data integration

Peakboard Designer supports a wide range of data sources, including SAP, SQL databases, MES, OPC UA, Excel, Modbus and MQTT. Integration is simple and requires no complicated interface programming.

Real-time data analysis & visualization

Data can not only be visualized, but also analysed and adjusted in real time. Dataflows can be used to transform, cleanse and aggregate data to enable informed decision-making.

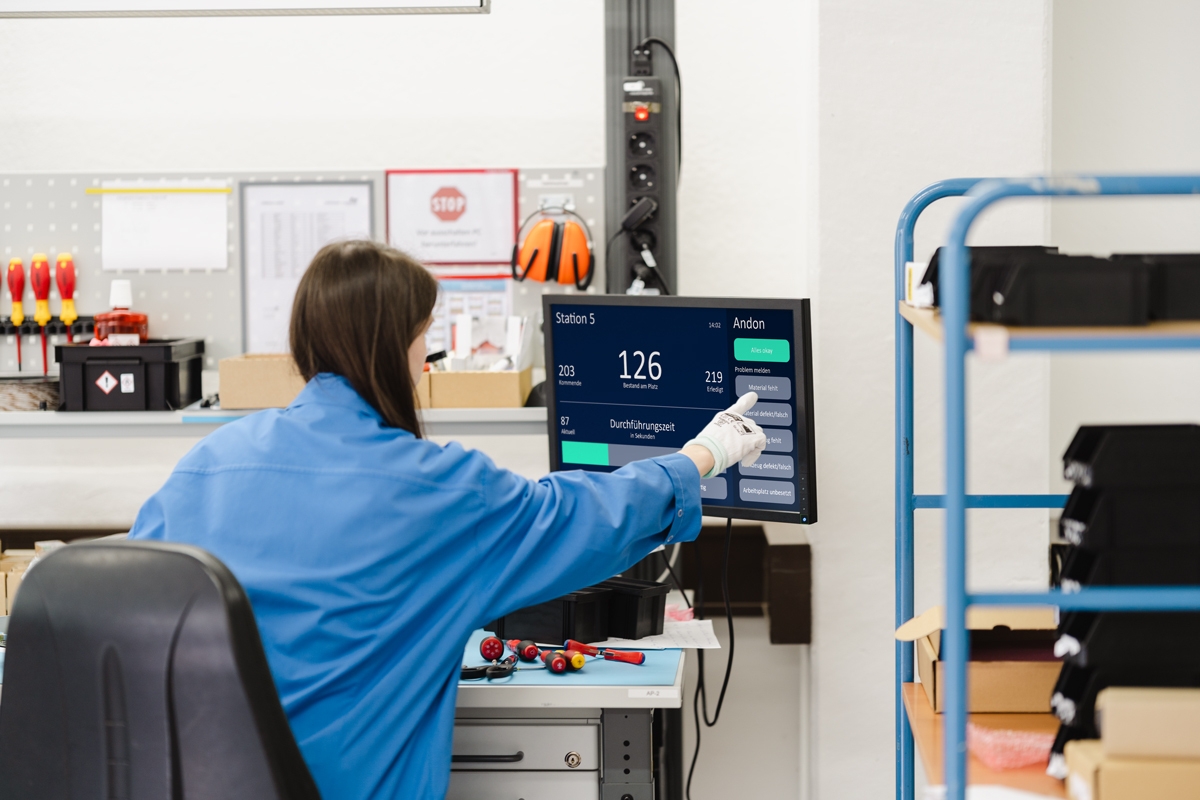
Interactive control and HMI functionality

With Peakboard as an HMI, machine and production processes can be controlled directly via the dashboard. Buttons and touchscreen interactions enable direct input and control of machine processes.

Templates and templates for fast working

The integrated template gallery offers numerous templates for different industries and use cases. This saves companies time and allows them to quickly adapt existing solutions.

Try it now for free!

Peakboard Designer can be downloaded and tested without registration. Take the opportunity to discover the software's versatile functions and make your business processes more efficient.

📞 Contact us for a personal consultation!

Interfaces:

Allen Bradley
CAN-Bus
Cassandra
Edge Connector
IBM DB2
IO-Link
IOT
JSON
LoRaWan
MariaDB
Microsoft
Microsoft 365
Microsoft Azure
Microsoft SQL Server
MongoDB
MQTT
MS Graph API
MS-SQL
MySQL
OPC UA
Oracle
PostgreSQL
Profibus
Profinet
REST
Rest API
REST-API
REST-API (ODATA)
REST/JSON
RestAPI
RFC-Schnittstelle zu SAP
Rockwell
SAP
SAP HANA
SAP R3
SAP S/4HANA
siemens S7
Softing
SQL
SQL Business
SQLite
ZigBee
Bluetooth
Modbus

Target groups:

Industrial companies, especially from the areas of production and (intra)logistics and related areas. Interesting for C-level and department heads who want to advance digitalization quickly, efficiently and cost-effectively.

References:

  • BOSCH - Transparency in semiconductor production - https://peakboard.com/success-stories/robert-bosch-gmbh/
  • CLAAS - Visualization of real-time data in the production of agricultural machinery - https://peakboard.com/success-stories/claas/
  • HERMES - Shopfloor management and digital dashboards - https://peakboard.com/success-stories/hermes-schleifmittel/
  • BIZERBA - MES System (Manufacturing Execution System) - https://peakboard.com/success-stories/bizerba/
  • ZARGES - Optimized robot utilization in production - https://peakboard.com/success-stories/zarges-gmbh/
  • ROSENBERGER - Seamless monitoring of production - https://peakboard.com/success-stories/rosenberger-gruppe/
  • PANKL RACING - From the magnetic board to the real-time dashboard - https://peakboard.com/success-stories/pankl-racing-system-ag/
Contact information:
Mr. Martin Neumann
Head of Sales
Herr Martin Neumann
+49 711 40 26 100 20
+49 176 46690705
Links & Downloads:
Information
direct to webpage
Request online demonstration
direct to webpage
Success story
direct to webpage
Software exposé
request URL
You will find us at the following trade fairs:
all about automation Hamburg

all about automation Hamburg - Hamburg

Period: 03.06. - 04.06.2025

Hall / stand:

About the fair
all about automation Düsseldorf

all about automation Düsseldorf - Düsseldorf

Period: 17.09. - 18.09.2025

Hall / stand:

About the fair
all about automation Chemnitz

all about automation Chemnitz - Chemnitz

Period: 30.09. - 01.10.2025

Hall / stand:

About the fair
 

Functions (excerpt) of Peakboard Designer:

Action tracking
Ad hoc reports
Annual reports
Assessment forms
Assessment tools
Auditfunction signature
Authorization management
Backup
Barcode recognition
Barcode scanner
Barcode, RFID
Block storage management
Break detection
Business Charts
Change management
Changeover time
Checklists
Competence and control functions
Consignment stock
Control plan
Control system
Corrective actions
Corrective and preventive actions
Dashboards
Data acquisition
Data analysis
Data and structures
data aquisition
Data Discovery
Data export
Data maintenance
Data management
Database
Dispatch of tasks
Disruptions
Distribution of reports
Document control
Documentation of QM
Downtime detection
Downtime Pareto analysis
Drill-down analysis
E-mail integration
Early warning indicators
Escalation management
Expiration date
Export formats
Forecasting
Full text search
Gate Management
Global Variables
Goal definition
Goods issue
Goods receipt
Graphical visualizations
Import formats
Import functions
Industry standards
Inspection data acquisition
Inspection management
Inspection order management
Inspection plans
Inspection reports
Integration of the control level
Inventory check
Inventory management
Item properties
key figure templates
Key figures and key figure systems
KPI
Label printing
Layout separation
Machine Condition Monitoring
machine inspections
Machine performance comparison
Maintenance
Malfunction log
Management reports
Master data management
Measurement data
Measurement protocols
Measures management
Measures overview
Measures status query
MTBF - Mean Time Between Failures
Multi-user capability
Multi-Warehouse capability
Multilingualism
Multitenancy
norms and standards
OEE Dashboard
Order management
Order management
Order tracking
order-related personnel time recording
Organization chart
Parts list management
Picking warehouse
Plant overview
Plant productivity (OEE/TEEP)
Plausibilities
Process control
Process data tracking
Process documentation
Processing times
Product data
Production control station
Production order management
Production reports
Production status
Qualification
Quality assurance
Quality management
Quantity recording
Queries
Real-time reports
Recording reasons
Report management
Reservation management
Resident survey
Returns management
Risk assessment
Role Management
Sampling system
Save search queries
Scrap analyses
Search
Set-up time evaluations
Shelf life management
Shift change
Standard entry documents
Statistical process control (SPC)
Stock movement logging
Stock strategies (FIFO, LIFO, FEFO)
Stock withdrawals
Storage location allocation
Storage location management
Strategy map creation
Structural changes
Supplier management
Target management
Target setup detection
Task generation
Task tracking
Test automation
Test result display
Time recording
User and time stamp
Visualization of loss causes
Warehouse layout
Warehouse locations
Warehouse management
Warehouse mirror
Warehouse technology
Web info system
WLAN connection
Workflow management

Prices

49.00
EUR
plus 19% VAT
monthly
BYOD Pro - own Hardware / selected interfaces
59.00
EUR
plus 19% VAT
monthly
Box Pro - Peakboard Hardware / selected interfaces
79.00
EUR
plus 19% VAT
monthly
BYOD Enterprise - own Hardware / all interfaces
89.00
EUR
plus 19% VAT
monthly
Box Enterprise - Peakboard Hardware / all interfaces
0
EUR
Demo Version
Test the full version for free - no time limit!

Get to know the software better! Request a video appointment for a personal presentation!

Technical specifications:

Web-based:
no
SaaS, Cloud:
yes
On-premises (local installation):
yes
AI Supported:
yes
Multi-user (network-compatible):
yes
Multi-client compatible:
yes
Maintenance:
included in price
Customizing:
included in price
First installation (year):
2016
Number of installations:
>10.000
Manufacturer based in:
Germany
Training:
on request
Hotline:
not required
Installation support:
included in price
Documentation:
Online Help, Demo version, Technical documentation
Dialogue language(s):
English, German
System requirements:
Compatible operating systems (runs with):
Win 11
Win 10
Win Server
Mainframe based
Unix based
Linux based
Mac OS
Mobile OSs (supports):
iOS
Android
Data storage medium:
DVD
CD-ROM
Download
Flash memory