What is meant by Display of the standstills?
The term "display of downtimes" refers to the visual representation of machine or production downtimes in real time or as reports. This function enables the display of ongoing and past downtimes in an overview to identify the causes, duration, and frequency of stoppages, and to take targeted measures to improve operational processes. The display of downtimes is a crucial component of production and maintenance management as it increases the transparency and traceability of machine availability.
Typical software functions in the area of "display of downtimes":
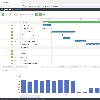
- Real-Time Dashboard: Visualization of current downtimes in real-time on a dashboard with graphical elements like bars, charts, or traffic light systems.
- Historical Downtime Data: Access to historical data on past downtimes, including detailed information on causes, duration, and affected machines.
- Alarm and Notification System: Automatic notifications when downtime occurs to immediately inform maintenance personnel.
- Filter and Search Functions: Filter options for specific display of downtimes by time period, machine, cause, or shift.
- Trend Analysis: Analysis of downtime trends to identify recurring patterns and derive preventive measures.
- Disruption Reports: Automated creation of reports on occurred downtimes for distribution to relevant stakeholders.
- Integration with Production and Maintenance Management Systems: Linking downtime displays with other systems to optimize production planning and maintenance strategies.
- Visualization of Downtime Durations: Display of downtime duration in the form of timelines or other graphical elements to quickly identify bottlenecks.
- KPI Overview: Display of key performance indicators such as OEE (Overall Equipment Effectiveness) or MTBF (Mean Time Between Failures) to evaluate machine performance.
- Custom Reports: Ability to create customized reports and visualizations of downtime data tailored to specific company requirements.
Examples of "Display of Downtimes":
- Current Disruption Display: Display of currently ongoing downtimes with information on the affected machine and expected resolution time.
- Past Downtimes: Presentation of all downtimes from the last month, including the respective causes.
- Top 5 Causes: Graphical display of the most common downtime causes over a specific period.
- Live Traffic Light Display: Real-time traffic light system visualizing machine status (Green: running, Red: downtime).
- Time Progress Chart: Display of downtime duration throughout the day or shift to identify production bottlenecks.
- Downtime Notification: Popup message in the system or push notification on mobile devices when downtime occurs.